
Dijkstra's algorithm finds the shortest paths from a start vertex in a directed graph whose edges have positive weights. It is a classic example of a greedy algorithm. If you had a course in algorithms, you probably learned it. Could you carry out the algorithm with an actual graph? Spend fifteen minutes with this training app, and you probably can.
You have a graph and a start vertex A. Each edge has a positive weight, the distance between its vertices:
What is the shortest distance to another vertex? Actually, it's just as easy to find the shortest distances to all other vertices. That's what Dijkstra's algorithm does.
We build up a set S of selected values. At first, we select the start vertex A. In each step, another vertex is selected, until the selected set contains all vertices that are reachable from A. (The algorithm is “greedy” because the solution grows without ever having to reconsider past choices.)
We associate with each vertex v a d value: the shortest distance to reach v with a path whose vertices are already selected (other than the end point v). We know at the outset that A.d is 0. For all other vertices we set v.d to ∞.
Each step of the algorithm has two parts:
In plain English, if it is better to reach n via s, then we have found a shorter distance.
At the end, the d values give the lengths of the shortest paths. To actually find those paths, each node should also track the preceding vertex s whenever the d value is updated: n.π = s.
At this point, if you are like me, your eyes may glaze over. Perhaps you are a visual learner? My favorite videos are the “Algorithms with Attitude” playlist of my former colleague David Taylor. Check this one out:
This really is a very good video. It covers all the salient points. But I would not be able to carry out the algorithm after watching it. I guess I am not a visual learner. I like to learn by doing.
When searching for “dijkstra algorithm interactive”, my search engine leads me to visualizations developed at the University of San Francisco and the Technical University of Munich. These are fine visualizations, but they are not interactive. They run on autopilot. If I wanted to learn from them, I would have to get out paper and pencil and try to follow along. But that's tedious. I want to do the steps in the tool and be told on the spot whether I did them right. That's learning by doing.
The OpenDSA textbook has its heart in the right place. First there is a follow-along slide show that's not interactive. (I don't count clicking a “Next” button as interactive engagement.)

And then the real thing. The activity displays a randomly generated graph and I can try the algorithm. And another graph. Until Dijkstra has been drilled into my brain.
Except, not really. The interactive visualization leaves out the most important part: the d and π values. Presumably the student is supposed to do them on a piece of paper. And hopefully get them right. There is no feedback.
Why don't they ask the students to enter and update the values? This section is clearly a work in progress, and perhaps they haven't gotten to it. Or maybe their JSAV toolkit doesn't make it easy? I could not figure out from the JSAV documentation how to add text input.
Surely there is a more effective interactive Dijkstra exercise out there somewhere, but I haven't found one.
Perhaps this really is a question of tooling. Check out this “interactive” end of chapter exercise. The weights are randomly generated, but the user interface is primitive.

It's not terrible. They do what they can. When the only tool they have is an input field. But you'd think that in 2023 one should be able to do much better.
In fact, a prior generation of CS educators routinely did a lot better. As soon as Java appeared in 1996, there was an explosion of applets for visualizing algorithms. Here is one example of many, a visualization of Dijkstra's algorithm, by Carla Jaffra:
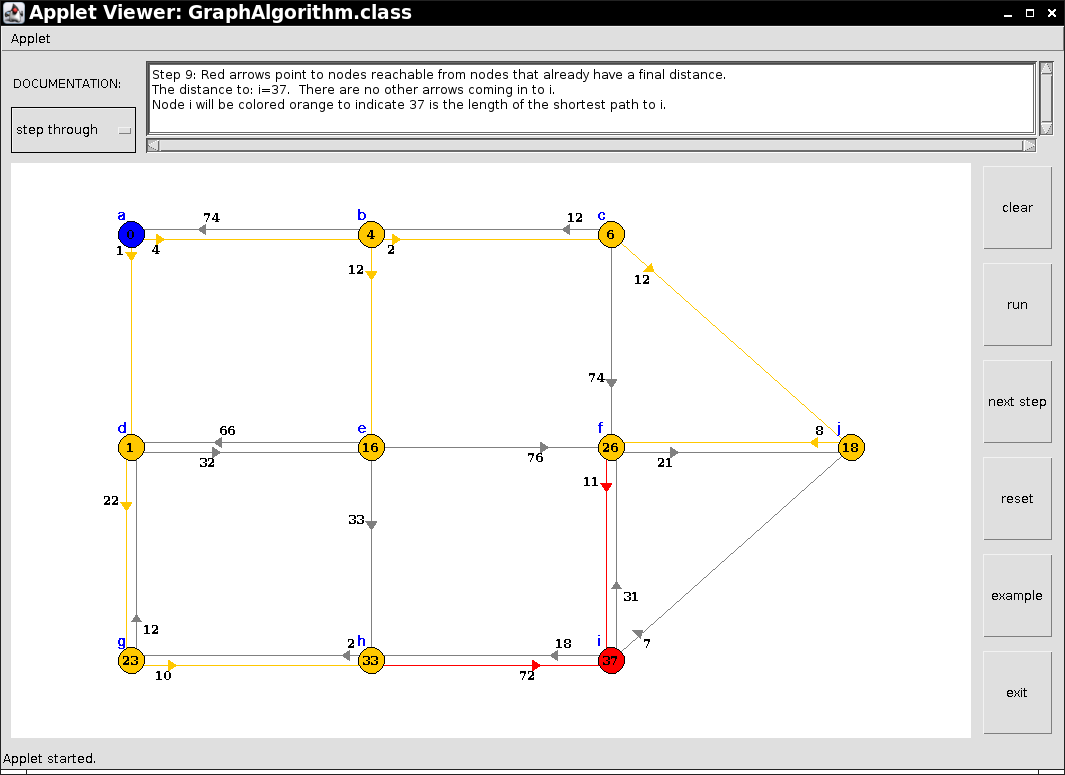
The activity could be more interactive, but my point is this: Almost 30 years ago, Java made it possible for anyone with reasonable programming skills to implement teaching tools with a much richer interaction than typing text into input fields. And to deploy them to the web, for everyone to use. Sadly, no modern browsers support applets, and all that effort is lost.
Could you do the same in JavaScript? Of course, you could. In fact, having deep experience in Swing programming and HTML/SVG/CSS/JavaScript, I take the web stack any time. But JavaScript experience doesn't seem that common in the educational community. The young'uns use Python. It is possible to produce a visualization in a Jupyter notebook, but it's not trivial, and you have to find someone to serve that notebook. It's a lot more work than putting up a web page. Python is fantastic for many teaching purposes, but for bringing interactive experiences to everyone, JavaScript is the tool of choice.
However, with JavaScript, there is a vexing issue. Look at the JSAV toolkit. It is nicely done. But it requires JQuery (ugh), together with JQuery Transit and Raphaël, libraries that have not been updated for years. They may be in great shape, or they may be abandonware. In the world of JavaScript, there is a tendency to chase the latest shiny object, and libraries morph and vanish at alarming rates. In the world of education, where materials ought to last for decades, that's not so wonderful.
My advice to anyone developing educational activities: Stick to vanilla JavaScript (and of course HTML, SVG, CSS). These days, you can do pretty awesome work with vanilla, and you greatly increase the likelihood that it will be useful years from now.
I wrote a toolkit to build code tracing exercises. Here is a simple example of such an exercise.
I have hundreds of such exercises in the electronic versions of my textbooks, My emphasis is squarely on fast exercise authoring. The exercise above has the following code:
import { addExercise, Code, Frame } from 'https://horstmann.com/codecheck/script/codecheck_tracer.js'
addExercise(function*(sim) {
  const code = sim.add(0, 0, new Code(`
int a = 5;
int b = 8;
int temp = a;
a = b;
b = temp;
`))
  const vars = sim.add(4, 0, new Frame())
  vars.a = 5
  vars.b = 8
  vars.temp = ''
  yield sim.start()
  code.go(3); yield sim.set(vars.temp, vars.a)
  code.go(); yield sim.set(vars.a, vars.b)
  code.go(); yield sim.set(vars.b, vars.temp)
})
Expressions such as vars.temp are “proxies”. Assigning to such an expression automatically updates the visual representation.
Note the use of yield whenever student input is required. This is even more useful inside loops which would be painful to implement in an event-driven or “reactive” style.
The toolkit consists of about 2,000 lines of vanilla JavaScript.
It wasn't built for graphs. No layout, no labeled edges. But it turns out it isn't that hard to do. About 200 lines of vanilla JavaScript. I used a simple Fruchterman-Reingold layout algorithm that is mostly good enough. Instead of trying to figure out how to avoid overlapping edge labels, I made the nodes draggable. Try it out with the example below. If the autolayout is unsatisfactory, clean up by hand.
Here is a Dijkstra exercise with the interaction that I want.
Can you use my exercise? Sure, point your students to https://horstmann.com/codecheck/examples/dijkstra.html.
Or embed it as an iframe. Iframes have a bad reputation, but they are just fine for embedded activities. The alternative isn't pretty. You'd have to figure out which JavaScript, CSS, and HTML to include in your own pages and hope that there is no version conflict if you have multiple activities.
For example, in the preceding section, I lost the will to live trying to include the first JSAV instance and ended up taking a screen shot that links to it. The second one was in an iframe, and it was trivial to include in this page.
What if you want to change the activity details? For example, you may not use π for the predecessor? (Why a greek letter anyway? “Pre” is Latin.) You can make a copy of my page, edit the JavaScript code, and host it somewhere. If you are ambitious, you can also change the way it works. Maybe add more hints.
Can you add the exercise to your learning management system (LMS) so that you can tell whether your students are actually doing it? That's where things get sad.
There is only one standard way for an activity to send score information to a LMS: LTI, which is quite heavyweight. It is not something that you can simply add to a web page. A server component is required. In the case of the CodeCheck tracer, you can use the CodeCheck Assignments service. It produces the LTI glue between interactive exercises, each in an iframe, and the LTI protocol.
In fact, it works with any iframes that send simple messages to the parent via postmessage. If you have an interactive JavaScript tool and want to send student scores to an LMS, talk to me!
Comments powered by Talkyard.